The Storage Dilemma
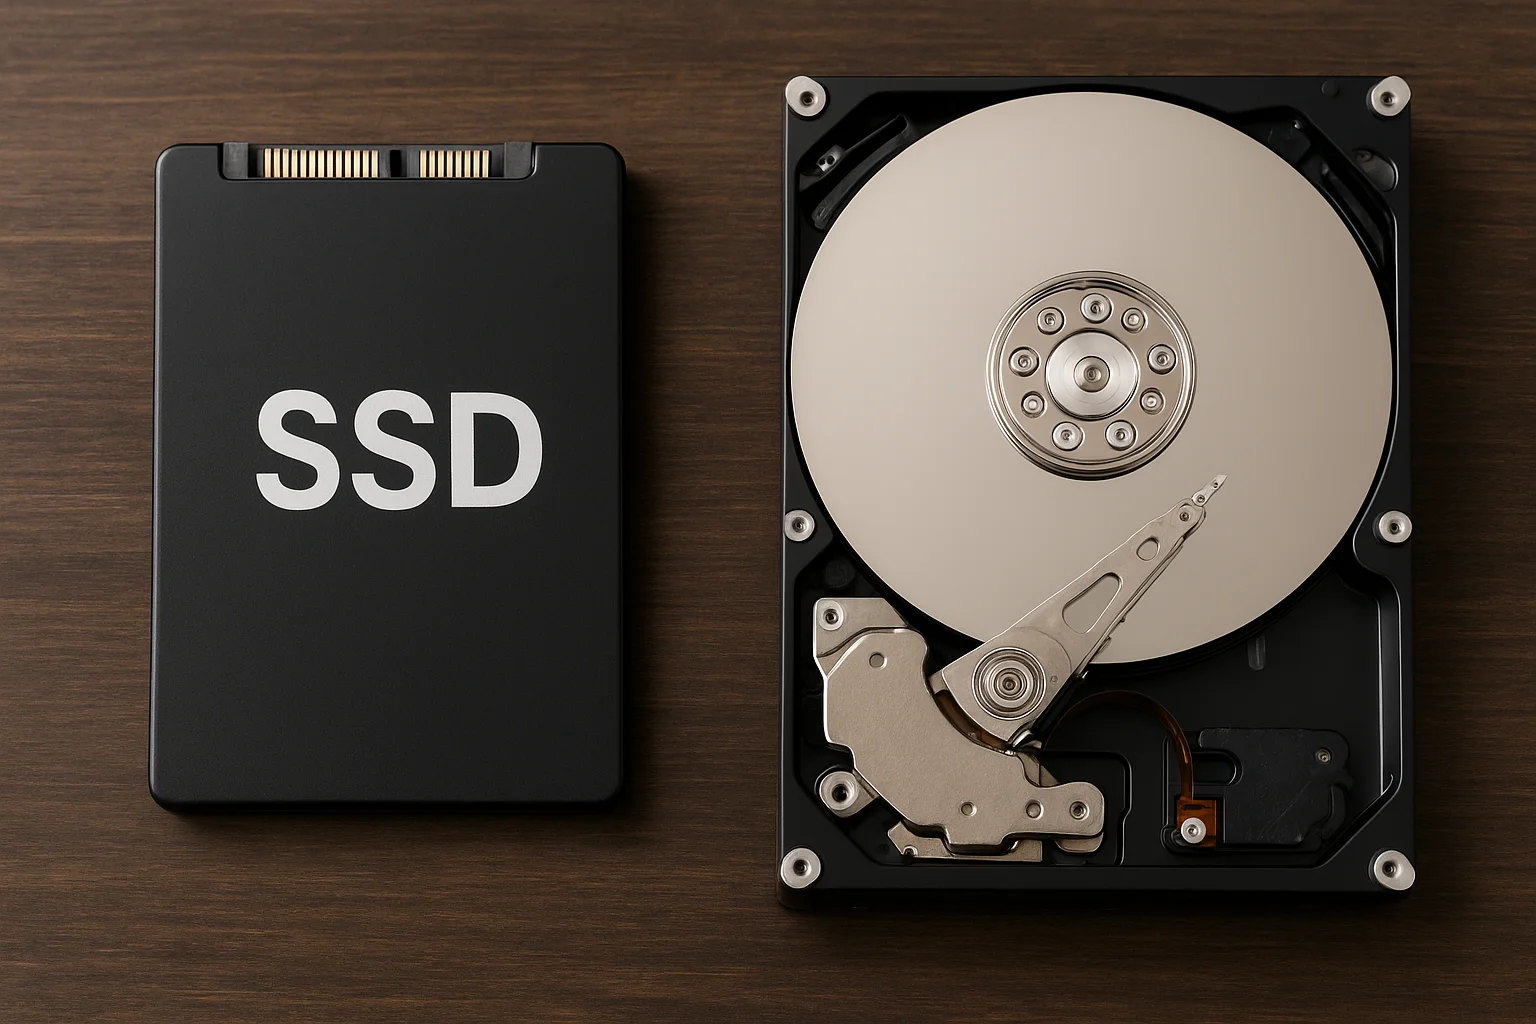
When buying a new computer or upgrading an existing one, one of the first choices you’ll face is the type of storage drive to use. For years, the traditional hard disk drive (HDD) was the default option, but today the solid-state drive (SSD) has become increasingly common. Both are widely available, yet they differ in how they store and access data, which directly affects your everyday experience with a computer.
The dilemma comes from the fact that there is no single “best” choice for everyone. An HDD generally offers large amounts of storage at a lower price, making it appealing for people who need to keep extensive libraries of photos, videos, or backups. On the other hand, SSDs are known for their lightning-fast performance, which improves system boot times, application launches, and overall responsiveness.
This leads to a crucial question for buyers: do you prioritize speed or capacity? The answer often depends on your personal needs, budget, and the way you use your device. For example, someone building a gaming rig may lean toward an SSD for faster load times, while a user who simply wants affordable storage for massive files may consider an HDD more practical.
Because both technologies continue to evolve and drop in price, the decision has become less straightforward. Users now have the flexibility to mix and match storage solutions, but understanding the strengths and weaknesses of each drive type is the first step in solving the storage dilemma.
Speed and Performance
Storage performance is primarily determined by three factors: latency (the time it takes to access the first byte), throughput (the amount of data transferred per second), and IOPS (the number of small input/output operations per second). The interface (SATA vs NVMe/PCIe), the storage medium (spinning platters vs NAND flash), and the controller/firmware all influence these results. Below is a comparison of typical consumer values to illustrate the differences.
Typical Performance by Drive Type
| Metric (typical consumer) | HDD (7200 RPM) | SATA SSD (SATA III) | NVMe SSD (PCIe 3.0/4.0 x4) |
|---|---|---|---|
| Average latency | 5–15 ms | 0.05–0.15 ms | 0.02–0.10 ms |
| Sequential read | 100–220 MB/s | 450–560 MB/s | 1,800–7,000+ MB/s |
| Sequential write | 100–200 MB/s | 400–520 MB/s | 1,500–6,500+ MB/s |
| 4K random read (QD1) | 75–200 IOPS | 7,000–20,000 IOPS | 15,000–60,000 IOPS |
| 4K random write (QD1) | 75–200 IOPS | 10,000–30,000 IOPS | 20,000–80,000 IOPS |
| Peak 4K random (high QD) | <400 IOPS | 50k–100k IOPS | 300k–1,000k+ IOPS |
| Consistency | Variable (seek times, fragmentation) | Stable | Stable, may throttle under heat |
These values are indicative ranges; real performance depends on the model, firmware, capacity, and workload.
Why these differences matter
- Latency defines system responsiveness: tasks like opening apps, switching windows, searching files, and background operations rely heavily on low latency and random I/O — areas where SSDs clearly outperform HDDs.
- Throughput impacts bulk transfers: copying movies, game installs, or exporting large projects depends on sequential speed. SATA is capped near ~600 MB/s, while NVMe can reach several GB/s.
- Queue depth changes the gap: at QD1 (typical desktop use), NVMe shows moderate gains over SATA, but under parallel loads the difference becomes dramatic.
Factors influencing SSD performance
- NAND and caching: Many SSDs use an SLC cache for burst speed. Once filled, sustained writes may drop significantly depending on NAND type (TLC vs QLC).
- DRAM vs DRAM-less: Drives with DRAM offer faster and more consistent random performance. DRAM-less SSDs rely on Host Memory Buffer (HMB), which is slower.
- Thermal throttling: NVMe drives can slow down under heavy workloads if they get too hot. A heatsink or airflow keeps performance stable.
- Free space and housekeeping: SSDs need spare capacity for garbage collection and wear leveling. TRIM support and over-provisioning improve consistency.
- Controller and firmware: Scheduling, error correction, and background tasks impact latency spikes and multitasking performance.
Where HDDs can still make sense
- Large sequential writes: HDDs maintain 100–200 MB/s for long backups or archival workloads, without worrying about cache exhaustion.
- Lower cost per terabyte: For massive storage needs with limited budget, HDDs still deliver better raw capacity per dollar.
Interface considerations
- SATA: capped around 550 MB/s in practice; still a huge leap from HDDs and ideal for older systems.
- NVMe/PCIe: extremely low latency and parallelism; PCIe 3.0 reaches ~3.5 GB/s, PCIe 4.0 up to 7 GB/s, with even higher on PCIe 5.0 — mostly beneficial for heavy workloads.
Practical tip: keep at least 10–20% of your SSD free for smoother performance and apply firmware updates provided by the manufacturer.
Storage Capacity and Price
Two practical questions guide most storage choices: How much space do you need? and what’s the cost per terabyte (TB)? Capacity needs vary based on use cases like large game libraries, RAW photography, or high-resolution video editing. Price depends on the technology, density, and interface. The table below summarizes typical consumer ranges.
| Aspect | HDD | SATA SSD | NVMe SSD |
|---|---|---|---|
| Common single-drive capacity | 1–8 TB mainstream; 10–20+ TB available | 500 GB–4 TB mainstream; up to 8 TB possible | 500 GB–4 TB mainstream; up to 8 TB possible |
| Form factors | 3.5″ (desktop), 2.5″ (laptop) | 2.5″ SATA | M.2 (PCIe/NVMe) |
| Indicative cost per TB | ~15–30 € / TB | ~60–110 € / TB | ~70–130 € / TB |
| Best value “sweet spot” | 4–8 TB (lowest €/TB) | 1–2 TB (balanced price/performance) | 1–2 TB (high performance with acceptable cost) |
| Budget example* | 8 TB ≈ 120–200 € | 2 TB ≈ 120–200 € | 2 TB ≈ 140–240 € |
| Scaling potential | Excellent (up to 20+ TB per disk) | Good, but €/TB rises above 4 TB | Good, but €/TB rises above 4 TB |
| Best suited for | Mass storage, archives, backups | System, apps, games, everyday storage | High-performance tasks, creative workflows |
*Indicative values only. Actual prices vary by brand, model, NAND type, capacity, and market conditions.
Estimating your storage needs
- Games: modern titles use 50–150 GB each; a 30-game library may require 2–4 TB.
- Photos: JPEG ~8–12 MB each; RAW ~25–35 MB; 100,000 RAW photos ≈ 2.5–3.5 TB.
- Video: consumer 4K60 H.264/H.265 ≈ 10–30 GB per hour; professional codecs require much more.
- Backups: apply the 3-2-1 rule and calculate total capacity based on copies (e.g., 2 TB of live data ⇒ 4–6 TB storage for versions + backups).
Factors that influence pricing
- NAND type: QLC drives are cheaper per TB but slower on sustained writes; TLC offers better balance.
- PCIe generation: NVMe PCIe 4.0/5.0 models cost more; the premium is worthwhile mainly for heavy workloads.
- Drive class: “Pro” models with higher endurance and warranty command higher €/TB.
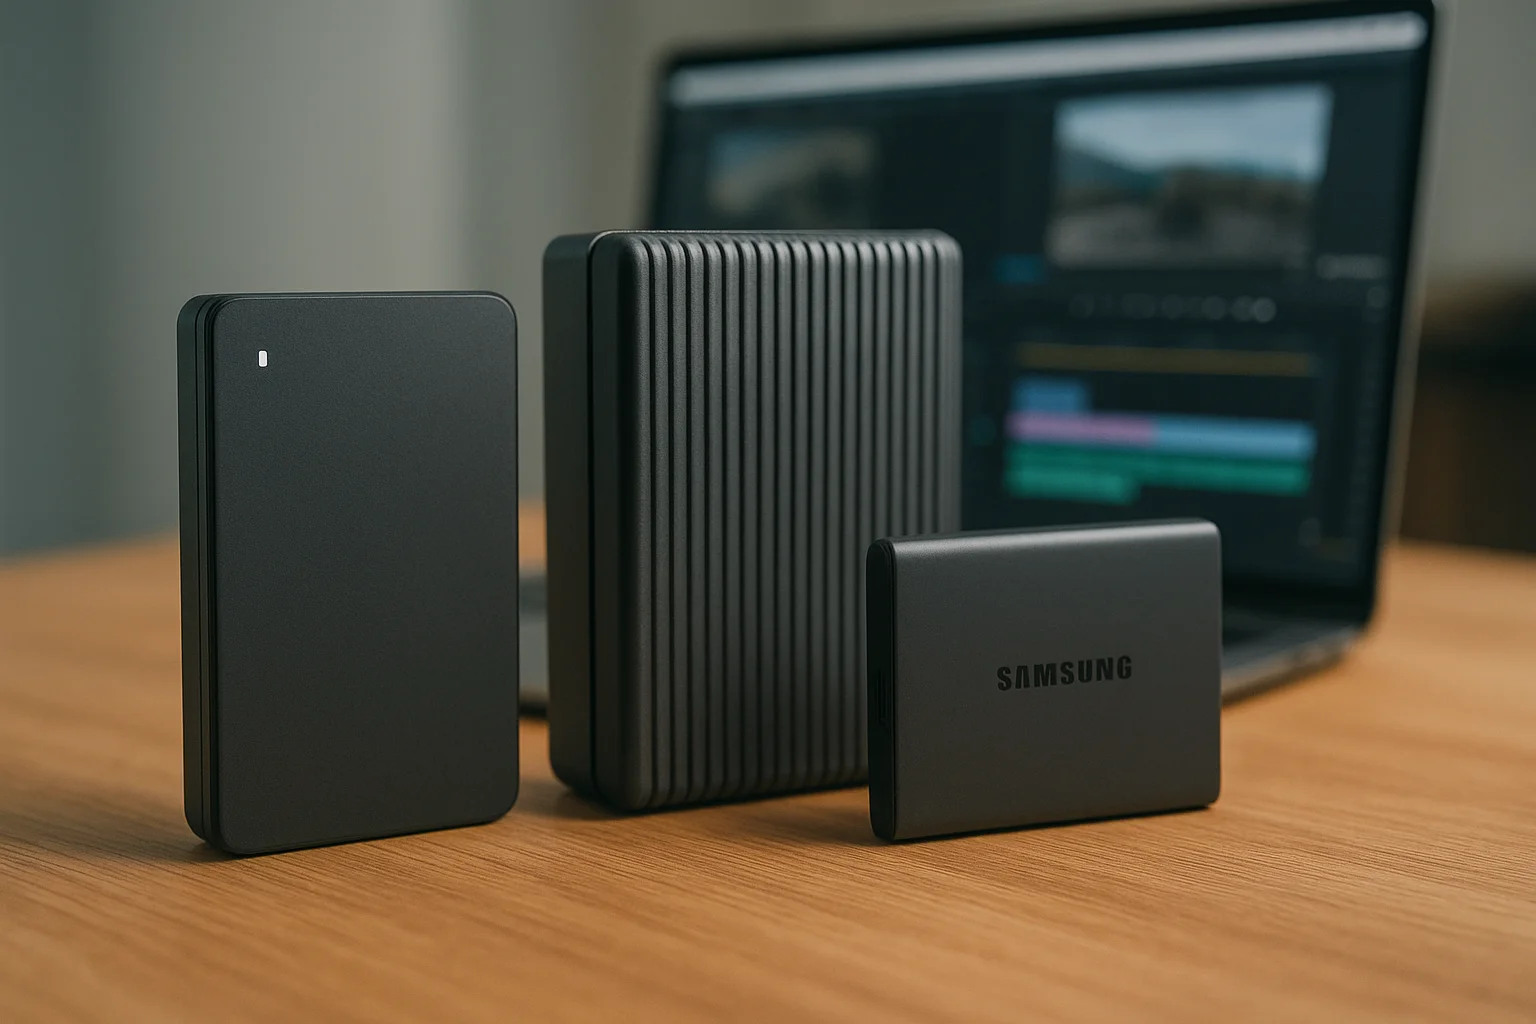
- External options: large external HDDs (USB 3.x) remain a cost-effective solution for cold storage.
Tip: A common strategy is to use a 1–2 TB SSD for system, apps, and active projects, then pair it with a high-capacity HDD for mass storage and backups. This balances speed and budget.
Durability and Reliability
Storage devices are not only about performance and capacity — their ability to last over time and resist failures is equally important. Durability refers to how well a drive handles physical shocks and wear from usage, while reliability focuses on the likelihood of data loss or drive failure during its lifetime. HDDs and SSDs differ significantly in these aspects due to their design.
Durability and Reliability Comparison
| Factor | HDD | SSD |
|---|---|---|
| Mechanical parts | Contains spinning platters and moving read/write heads; sensitive to drops, vibrations, and shocks. | No moving parts; more resistant to physical impact and better suited for laptops or portable devices. |
| Shock resistance | Generally 50–350 Gs; even small bumps can cause head crashes. | Typically 1,500–2,000 Gs; can survive accidental drops with minimal risk of data loss. |
| Heat tolerance | High heat can cause platter expansion or mechanical misalignment. | More tolerant of temperature changes, though extreme heat can degrade NAND cells faster. |
| Write endurance | No practical write limit, though mechanical wear can occur over many years of use. | Measured in Terabytes Written (TBW) or Drive Writes Per Day (DWPD); limited but sufficient for normal consumer workloads. |
| Failure patterns | Gradual failure with warning signs (strange noises, bad sectors). | Can fail suddenly when NAND or controller wears out, though SMART monitoring helps anticipate issues. |
| MTBF (Mean Time Between Failures) | ~1–2 million hours (theoretical); real-world often lower due to moving parts. | ~1.5–2.5 million hours; fewer moving components contribute to higher reliability. |
| Data retention when unused | Can hold data reliably for many years if not physically damaged. | Data retention depends on NAND type and wear; consumer drives typically retain data 1–3 years without power. |
| Best suited environments | Static desktop setups, archival storage, non-portable environments. | Portable laptops, external drives, high-vibration environments, mission-critical speed-sensitive workloads. |
Key considerations for users
- Physical resilience: SSDs are much more durable against shocks, making them safer for travel and mobile use.
- Write endurance: Modern SSDs with TLC NAND can handle hundreds of TBW, translating into many years of normal usage before wear-out becomes an issue.
- Failure modes: HDDs tend to fail progressively, often giving users time to back up data, while SSDs may fail more abruptly once their write cycles are exhausted.
- Data retention: For long-term offline storage, HDDs may remain preferable, as SSDs rely on stored charges in NAND cells that can degrade if left unpowered too long.
- Monitoring: Both drive types support SMART data, which helps track wear, bad sectors, or reallocated blocks to predict failure.
Tip: Regardless of durability, always maintain a backup strategy. No storage medium is immune to sudden failure or external risks like power surges or accidental damage.
Power Consumption and Noise
Beyond speed and storage capacity, two often overlooked aspects of drives are their power efficiency and noise levels. These factors matter most for laptops, energy-conscious desktops, and quiet work environments. HDDs and SSDs show very different behavior because of their design: HDDs rely on mechanical rotation, while SSDs operate with solid-state memory.
Comparison of Power Consumption and Noise
| Factor | HDD | SSD |
|---|---|---|
| Idle power draw | 3–7 W (depending on RPM and size) | 0.05–0.5 W (very low, almost negligible) |
| Active read/write power | 6–10 W (can spike higher under load) | 2–4 W (SATA) or 3–6 W (NVMe under heavy load) |
| Spin-up/start power | 15–25 W peak when platters accelerate | None, instant-on |
| Noise level during idle | 20–30 dBA (audible hum from spinning platters) | 0 dBA (completely silent) |
| Noise during activity | 30–50 dBA (clicking, seeking, vibration) | 0 dBA (no moving parts) |
| Heat generation | Noticeable; may require airflow or cooling in confined cases | Much lower; minimal heat even under load |
| Impact on battery life | Higher drain; laptops may lose 30–60 min runtime compared to SSD | More efficient; extends battery life significantly |
Why power and noise matter
- Laptops and ultrabooks: SSDs improve portability by using less power and producing no noise, extending runtime and comfort in quiet places like libraries or offices.
- Desktops: Although desktops can handle higher wattage, replacing multiple HDDs with SSDs reduces electricity costs and case vibration.
- Data centers: Power efficiency scales dramatically. Replacing thousands of HDDs with SSDs lowers operational costs for electricity and cooling.
- Acoustic comfort: HDD clicking and humming can be disruptive in studios, bedrooms, or quiet workspaces, while SSDs remain completely silent.
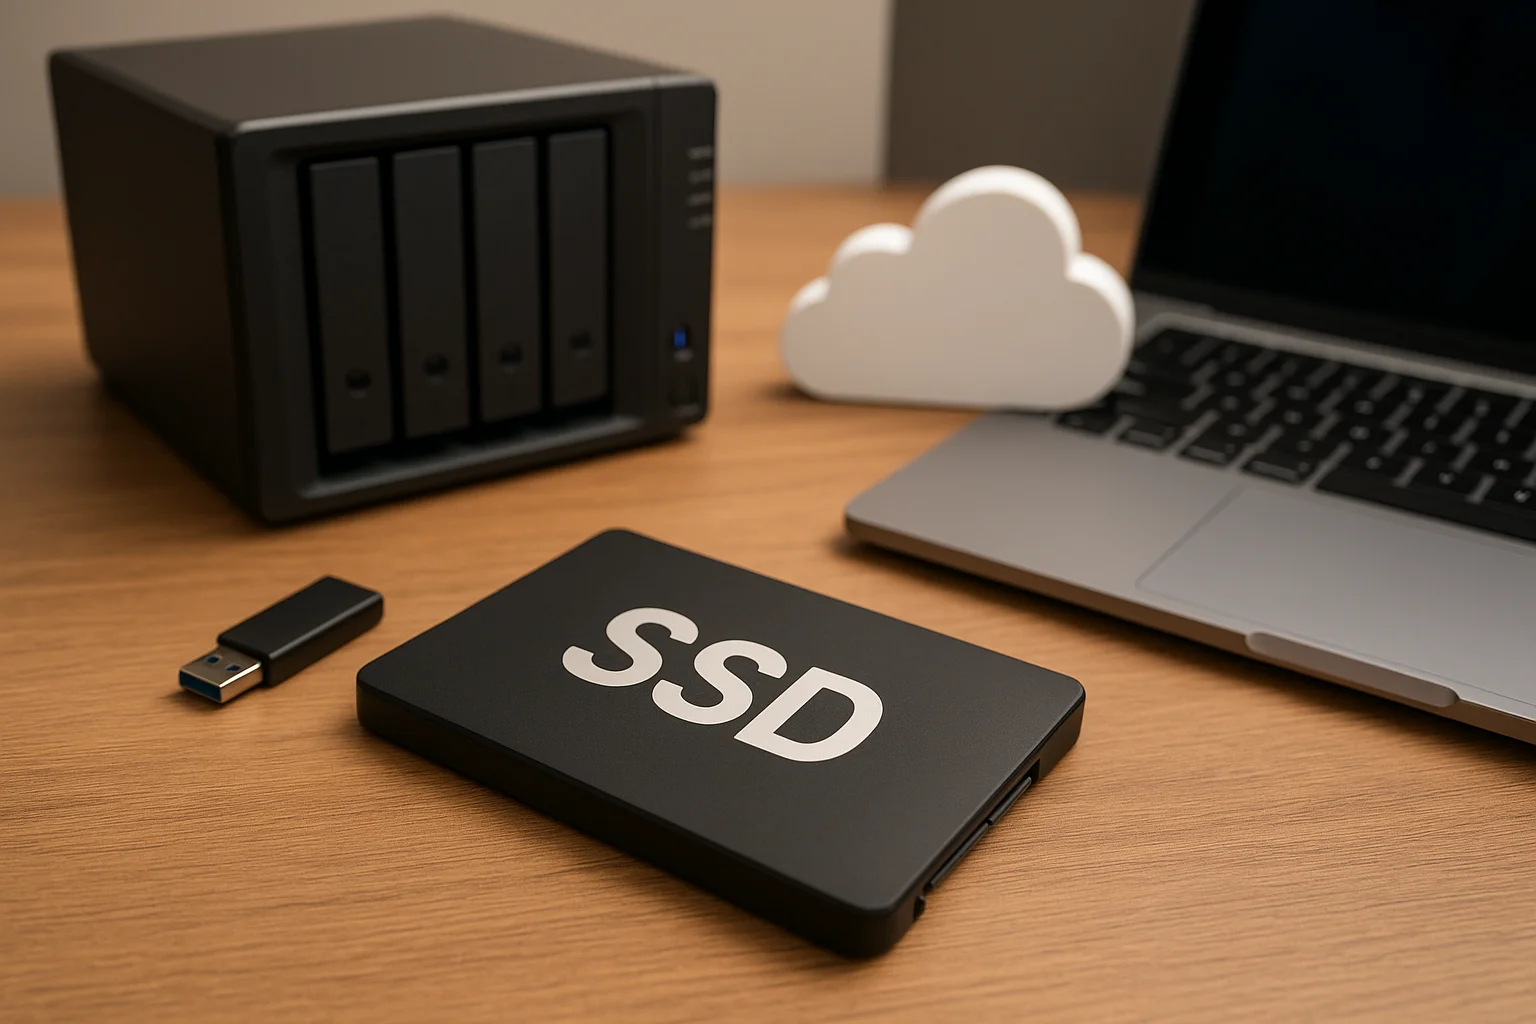
Tip: If you want a silent PC build or need maximum laptop battery efficiency, an SSD is the best choice. HDDs are better kept in external enclosures or NAS setups where noise and power are less of a concern.